Live Well San Diego Children & Families Data Hub
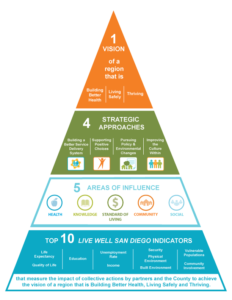
Live Well San Diego is a vision for a region that is Building Better Health, Living Safely, and Thriving. Building upon this vision, the Live Well San Diego Children & Families Data Hub (formerly known as the Live Well San Diego Report Card on Children, Families, and Community) documents the status of health, safety, and well-being of children, families, and communities in San Diego County, California.
In alignment with the Live Well San Diego Top 10 Indicators and Areas of Influence, the indicators within this Live Well San Diego Children & Families Data Hub are categorized with symbols that correspond to the Areas of Influence.
Areas of Influence
Enjoying good health and expecting to live a full life

Learning throughout
the lifespan
Having enough resources for a quality life
Living in a clean and safe neighborhood
Helping each other to live well
Children & Families Data Hub Indicators
Birth to Age 3
Infants & Toddlers
 Breastfeeding
Percentage of mothers who initiated breastfeeding of newborn in hospital
95.5%
(2022)
Updated
 Birth to Teens
Birth rate per 1,000 females ages 15-17
Ages 3 to 6
Preschool
 Immunization
Percentage of young children (ages 19-35 months) who completed the basic immunization series
 Early Care & Education
Percentage of children ages 3-4 enrolled in early care and education
46.9%
(2023)
New
Ages 6 to 12
School Age
 Oral Health Children
Percentage of children under age 12 who had not visited a dentist in more than one year or ever
15.6%
(2 year average of percentage of 2022-2023)
Updated
 School Attendance
Percentage of elementary school (K–5) students who did not attend school at least 95% of school days
 School Achievement Grade 3
Percentage of students in grade 3 who met or exceeded standard in English-Language Arts/Literacy
49.9%
(School Year 2023-24)
Updated
Ages 13 to 18
Adolescence
 School Attendance
Percentage of middle and high school students (grades 6–12) who did not attend school at least 90% of school days
 School Achievement Grade 8 & 11
Percentage of students in grade 8 and 11 who met or exceeded standard in English-Language Arts/Literacy
49.4%
(Grade 8 in School Year 2023-24)
59.5%
(Grade 11 in School Year 2023-24)
Updated
 Obesity Children
Percentage of adolescents ages 12–17 who are overweight or obese (85th percentile and above for body mass index)
32.5%
(2 year average of percentage of 2022-2023)
Updated
 Substance Use
Percentage of students in grades 7, 9, and 11 who reported use of cigarettes, e-cigarettes/vaping, alcohol, or marijuana in prior 30 days
| Grade | 7 | 9 | 11 |
|---|---|---|---|
| Cigarettes | 1% | 1% | 1% |
| E-cigarettes | 3% | 5% | 7% |
| Alcohol | 3% | 6% | 12% |
| Marijuana | 2% | 4% | 9% |
 Youth Suicide
Percentage of students (grades 7, 9, 11) who reported they had considered attempting suicide in prior 12 months
14%
(Grade 7 in School Year 2022-23)
14%
(Grade 9 in School Year 2022-23)
14%
(Grade 11 in School Year 2022-23)
 Juvenile Crime
Rates of arrests for felony and misdemeanor offenses among youth under Age 18
18.1 per 10,000 Ages 0-17
(Felony 2023)
16.9 per 10,000 Ages 0-17
(Misdemeanor 2023)
New
 Juvenile Probation
Number of sustained petitions (“true finds”) in juvenile court among youth ages 10-17
1,276
(2024)
New
 Youth DUI
Number of DUI arrests among youth under age 21
Adult
 Oral Health adults
Percentage of adults ages 18-65 who had not visited a dentist in more than one year or ever
26.5%
(2023)
Updated
 Substance Use adults
Percentage of adults ages 18 and older who reported smoking
4.5%
(2023)
Updated
Community & Family
Cross Age
 Nutrition Assistance
Number of CalFresh (SNAP) recipients, children ages 0-18 and adults ages 19 and older
(Children Ages 0-18 in 2024)
(Adults Ages 19 and Older in 2024)
New
 Health Coverage
Percentage of children ages 0-17 without health coverage
(Statistically unstable data)
 Domestic Violence
Rate of domestic violence reports per 1,000 households
14.9 per 1,000 households
(2022)
 Child Abuse & Neglect
Rate of substantiated cases of child abuse and neglect per 1,000 children ages 0-17
3.3 per 1,000 Ages 0-17
(2023)
 Child Victims of Violent Crime
Rate of violent crime victimization per 10,000 children or youth
 Unintentional Injury
Rate of non-fatal unintentional injuries per 100,000 children ages 0-14
318 per 100,000 Ages 0-14
(2023)
New
 Childhood Mortality
Mortality rate per 100,000 children ages 1-4, 5-14, and 15-19
